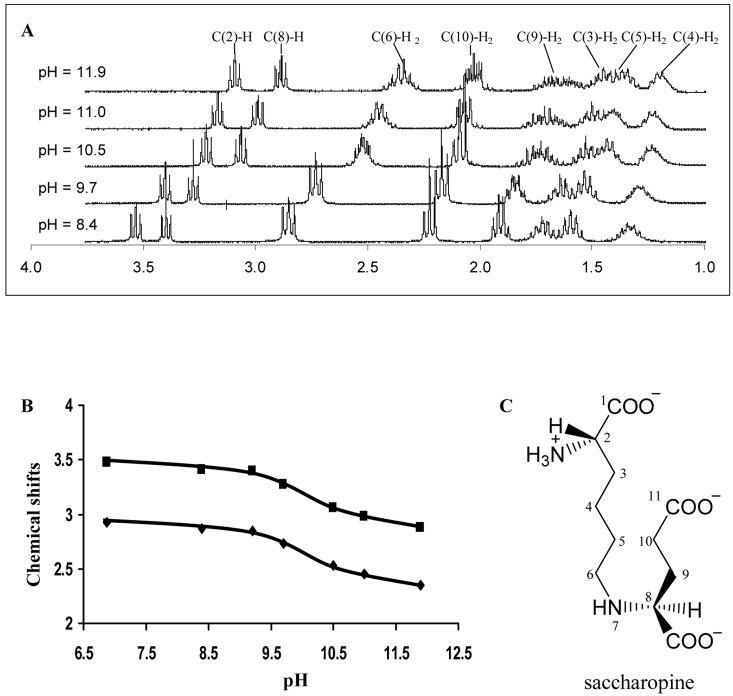
Figure 1.
pH Dependence of the 1H-NMR Spectrum of Saccharopine. A. 1H-NMR spectra of saccharopine measured at the indicated pH values. Chemical shifts are referred to the carbons of saccharopine. B. pH dependence of the chemical shift of protons β to the secondary amine of saccharopine. Data are presented for the C(8)-H (■) and C(6)-H2 (▲) positions. C. Structure of saccharopine with main chain atoms labeled.

