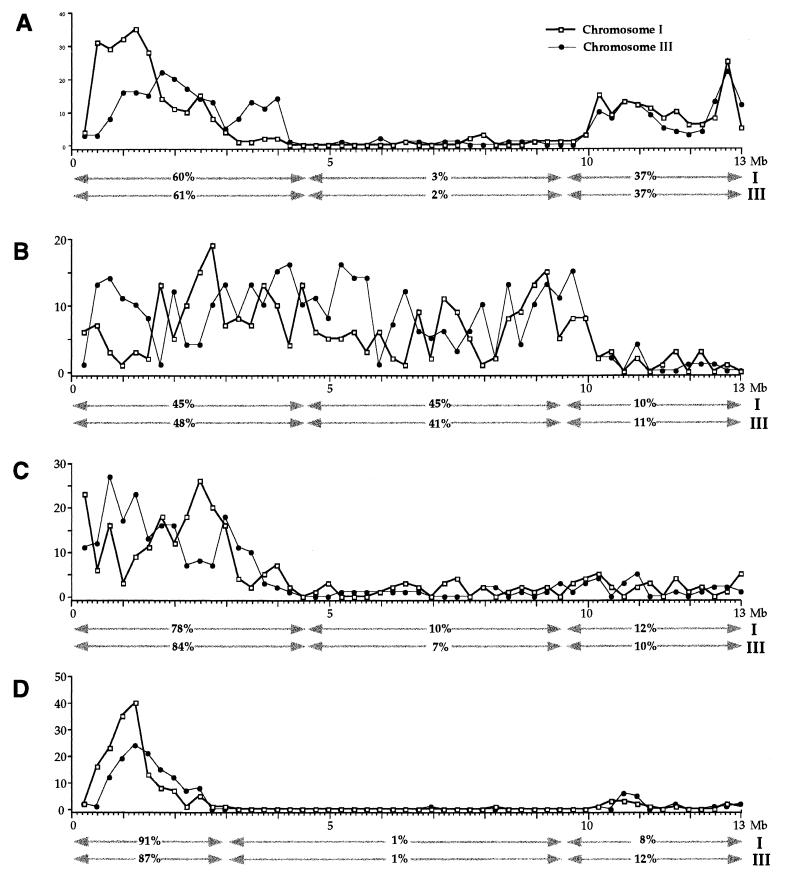
Figure 3.
Distribution of repetitive elements on C. elegans chromosomes I and III. The figure shows the distributions of Cele14 (A), Cele2 (B), Cele1 (C), and Cele42 (D) MITE-like repeats. The number of the individual repeat family members per 200 kb is plotted relative to the 13 Mb of sequence downloaded from each chromosome (see Figs. 1 and 2). The distribution of elements on chromosome III is inverted relative to standard genetic and physical maps.

