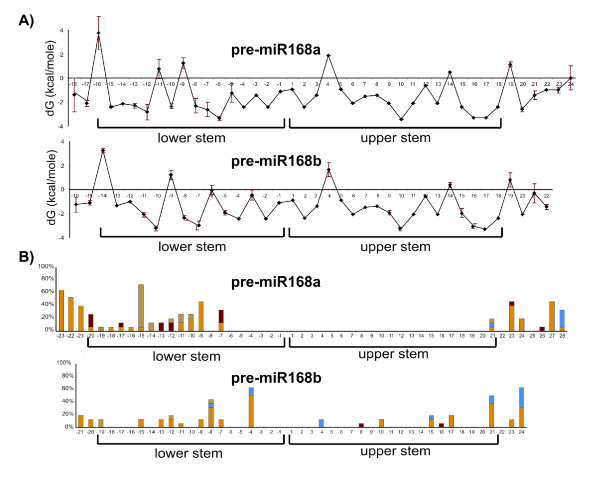
Figure 4.
Thermodynamic stability and nucleotide substitution profiles of pre-miR168a and pre-miR168b. A) Thermodynamic stability profile of pre-miR168a and pre-miR168b in the Brassicaceae family. Free energy values are given in kcal/mole. Vertical bars: between-species variability calculated as double standard error. B) Distribution of nucleotide substitutions with respect to base pairing in the pre-miR168a and pre-miR168b secondary structures. Yellow: structurally conservative base substitution; ochre: base substitution comporting a change in length of a bulge loop; blue: base substitution comporting a change from unpaired to paired bases; red: base substitution comporting a change from paired to unpaired bases. The rate of nucleotide substitution is given in percentages.

