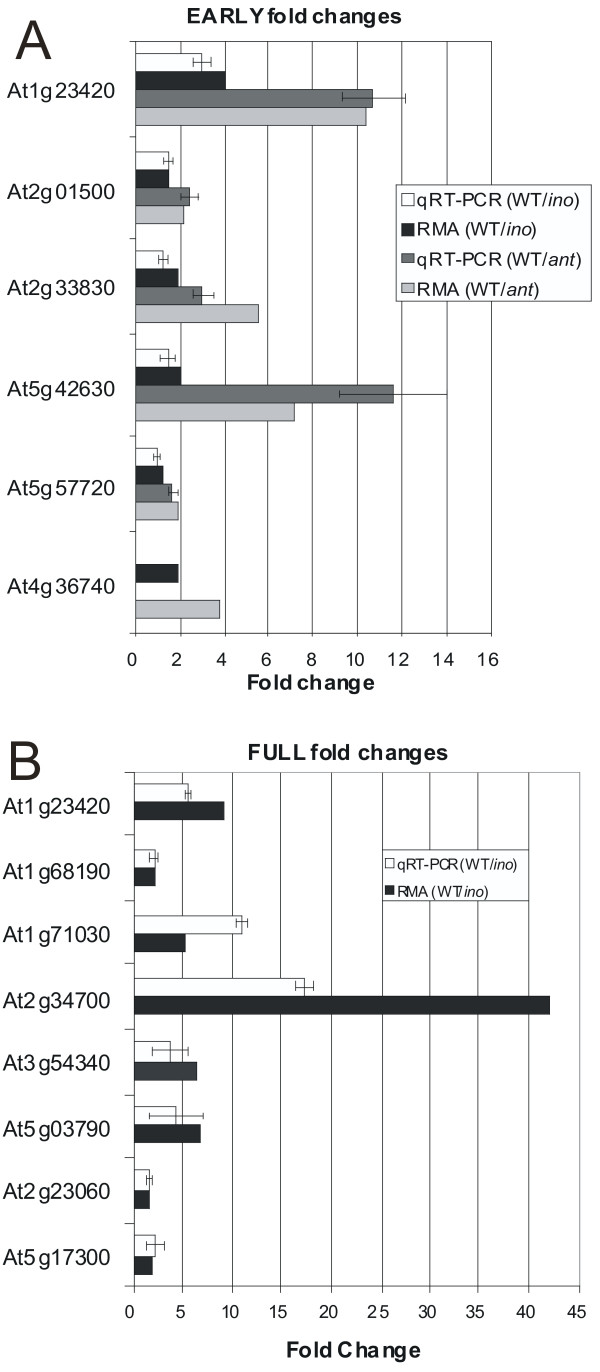
Figure 5.
Comparison of values obtained for differential expression using qRT-PCR and microarrays. Relative expression levels obtained through qRT-PCR were compared with microarray expression levels (RMA derived) for selected genes. Error bars for qRT-PCR values are the standard deviations (n ≥ 3). (A) Comparisons between WT E and ant E, and between WT E and ino E. For the gene At4g36740 no amplification product was obtained from the mutants, indicating that mRNA for this gene was below the limit of detection using qRT-PCR. (B) Differential expression between WT F and ino F.

