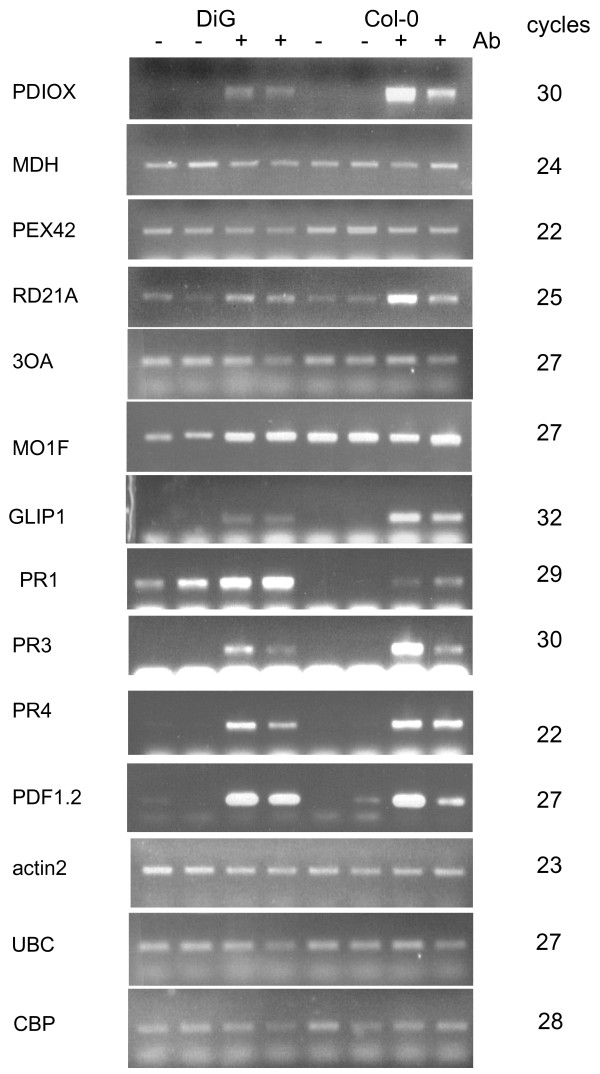
Figure 2.
Semi-quantitative RT PCR analysis of transcript levels of selected genes. - and + indicate samples from control and inoculated intact plants, respectively. RNA was isolated by harvesting the entire leaf at 72 h after inoculation. Duplicate lanes indicate two independent experiments on different sets of plants; the number of amplification cycles is indicated at the right.

