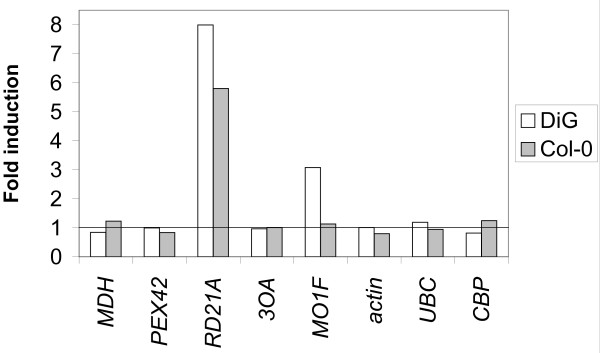
Figure 3.
Expression of the monooxygenase gene MO1 is preferentially up-regulated in the compatible interaction. Relative transcript levels were calculated from the intensity of the RT-PCR signals shown in Figure 2, as follows. Infected Col-0 was chosen as the reference treatment. The band intensities of the three reference genes (ACT2, UBC and CBP20) then showed similar expression patterns as a function of experiment and replicate, over the entire data set, with no clear trend as a function of treatment. This indicates that the transcript levels of these genes varied with the amount of RNA and efficiency of the reactions, rather than with the treatment. All data for the reference genes were therefore combined, and the entire data set normalized to the combined reference values to obtain the signal plotted as "fold induction" (y-axis).

