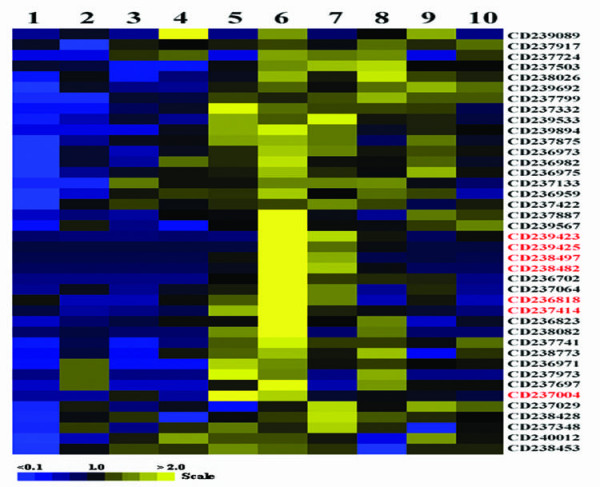
Figure 4.

Tissue expression patterns of 40 novel ESTs from human fetal pituitary. Relative levels of novel ESTs in different tissues were evaluated by semi-quantitative RT-PCR, and were represented as color boxes with shades on a scale based on the average ratio of the density of PCR product band between the experimental gene and reference gene β-actin. The patterns were clustered and viewed using Gene Cluster and TreeView software (Stanford University). The relatively pituitary-specific ESTs were indicated by words in red. 1, heart; 2, spleen; 3, lung; 4, muscle; 5, brain; 6, fetal pituitary; 7, testis; 8, kidney; 9, thymus; 10, small intestine.
