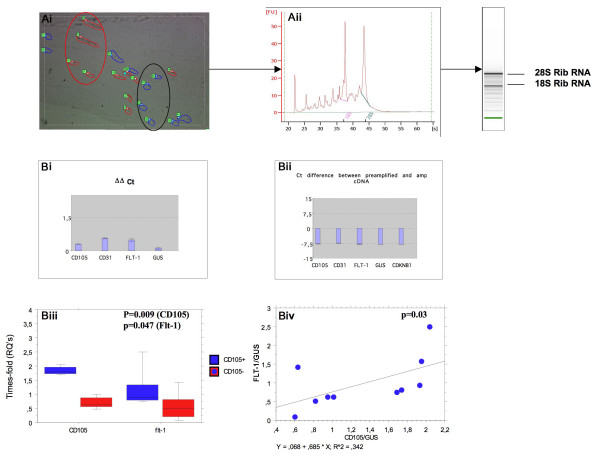
Figure 2.
A, (i) Area with discreet region of CD105-positive (red; circle) and CD105-negative (blue: circle) vessels captured with the laser. (ii) RNA extraction from multiple combined laser cut sections showing good RIN and concentration. B, (i-ii) Shows non-significant differences in ΔCts between pre-amplified genes indicating no bias in gene amplification. (iii) Significant increases in gene expression of CD105 and Flt-1 in the positively selected samples indicated the sampling/IHC was accurate. (iv) Significant correlation between CD105 and Flt-1 expression in all the tested samples indicated reliability of the markers to discriminate between active and inactive vessels.

