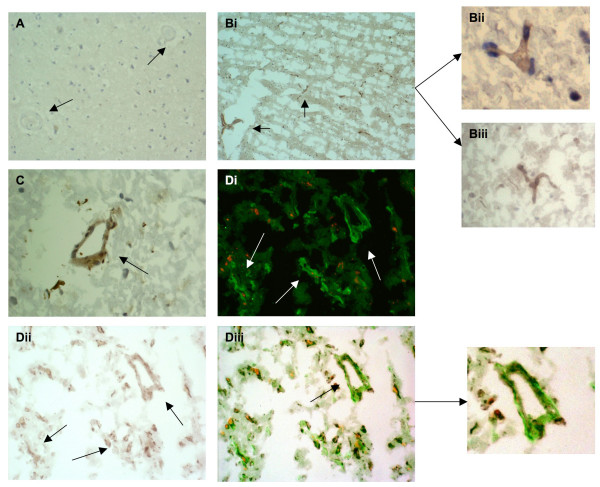
Figure 4.
HGF-α expression in stroke tissue: A, tissue from the contralateral hemisphere showed no observable staining (negatively stained blood vessels are marked with arrows; × 40). B, stroked brain tissue showing many small microvessels stained positive for HGF-α (i; × 40) and (ii and iii) at higher magnification (× 100). C, shows a medium sized microvessel strongly staining for HGF-α in peri-infarcted tissue (× 100) and Di-iii, double immunoflourescence showing co-localization of HGF-α (red) and CD105 (green) in peri-infarcted stroke tissue (× 100; sections from I0615P were used).

