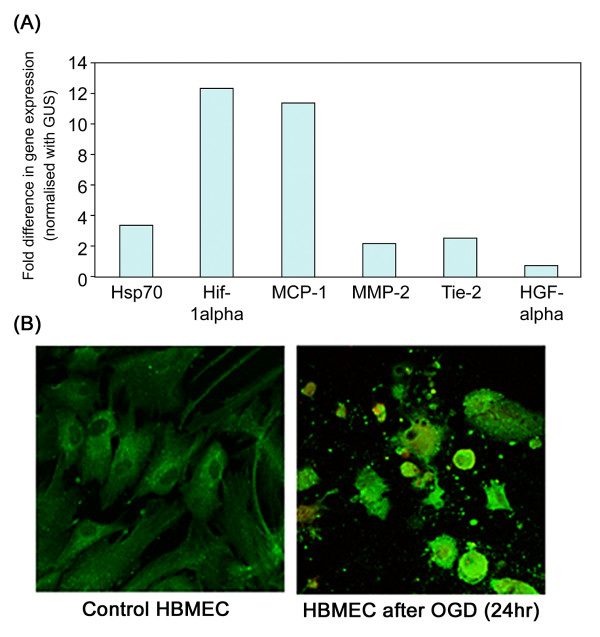
Figure 8.
A, Graph showing results from real-time RT-PCR with HBMEC exposed to 24 h OGD demonstrating a notable increase in HSP-70 and HIF-1α (control genes) and concomitantly an increase in expression of MMP-2, Tie-2 and MCP-1. B, shows immunoflourescent staining of HBMEC for MMP-2. Control cells expressed MMP-2 weakly in peri-nuclear areas whilst HBMEC demonstrated a large increase in cytoplasmic expression following OGD (24 h) (× 100; MMP-2 stained green with FITC). All experiments were carried out twice in duplicate and representative pictures are shown.

