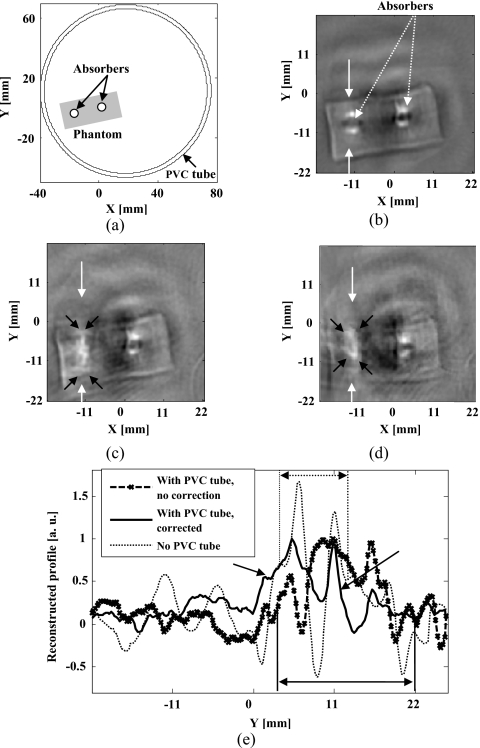
Figure 7.
Experimental results with two strong absorbers: (a) Schematic of the phantom sample used in experiments; (b) reconstructed image with no PVC tube present. The boundaries of the two absorbers are shown clearly in the reconstructed TAT image. (c) Reconstructed TAT image using the filtered back-projection method. PVC tube was used to simulate the skull effects. (d) Reconstructed TAT image using the proposed numerical method. The raw data was the same as the one used for (c); and (e) Comparison of the reconstructed signals at the depth as marked on (b), (c) and (d).

