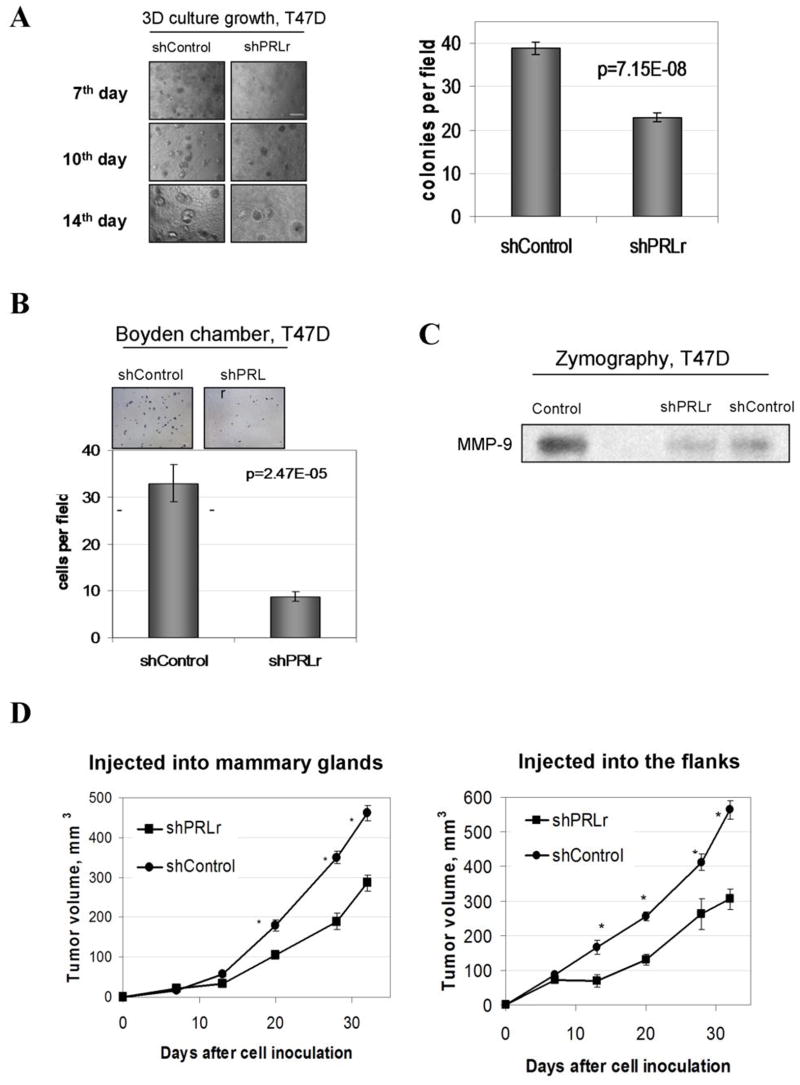
Figure 6. Analysis of growth, invasiveness, and tumorigenicity of T47D cell lines.
A. Representative morphology of indicated T47D cell lines growth in three-dimensional cultures at the indicated day after plating. The experiment was repeated twice. Scale bar - 15μM. The graph represents percent surface ± SE covered by cell growth calculated from nine of 10x magnification pictures (triplicates).
B. Migration of indicated T47D cells through Boyden chambers was analyzed as described in the Materials and Methods. The undersides of membrane inserts containing invaded cells fixed and stained with Eosin-Hematoxylin were photographed 72h after the plating using a 10X objective. Scale bar - 100μM. The graph represents number of invasive cells ± SE calculated from nine of 20x magnification pictures (triplicates).
C. Relative activity of MMP-9 in the indicated T47D-derived cells was analyzed by zymography as described in the Material and Methods.
D. Tumor volumes of indicated T47D breast cancer cells injected into either mammary glands or the flanks of the NRS mice were calculated as described in the Materials and Methods. Asterisks denote statistically significant (p<0.01) between the volume of tumors formed by T47D-derivatives that harbor indicated shRNA constructs.

