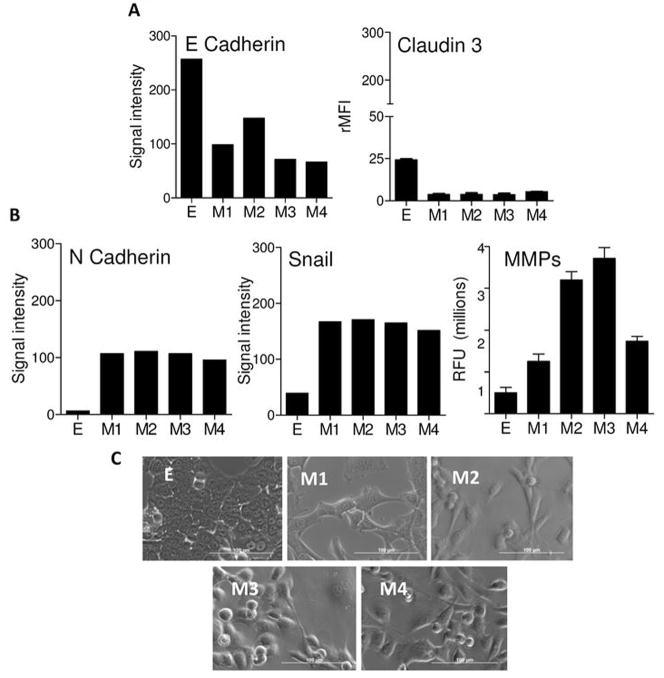
Figure 2. Stable cell lines from tumor cells that underwent EMT were established.
Panel A shows expression levels of E-cadherin and claudin 3 in E and M cell lines. The E-cadherin experiments were repeated independently 3 times with similar results. Claudin 3 was measured using flow cytometry and each bar is the mean (s.e.m.) of 2 separate experiments. Panel B shows expression of N-cadherin, and Snail, and matrix metalloproteinase (MMP) activity for all cell lines. The bars represent the signal intensity derived using RT-PCR. RT-PCR results are representative of 2 experiments that gave nearly identical results. For MMP activity each bar is the mean (s.e.m.) of 3 samples. Panel C shows light microscope pictures (40X) of the cell lines. Bar=100 μm.

