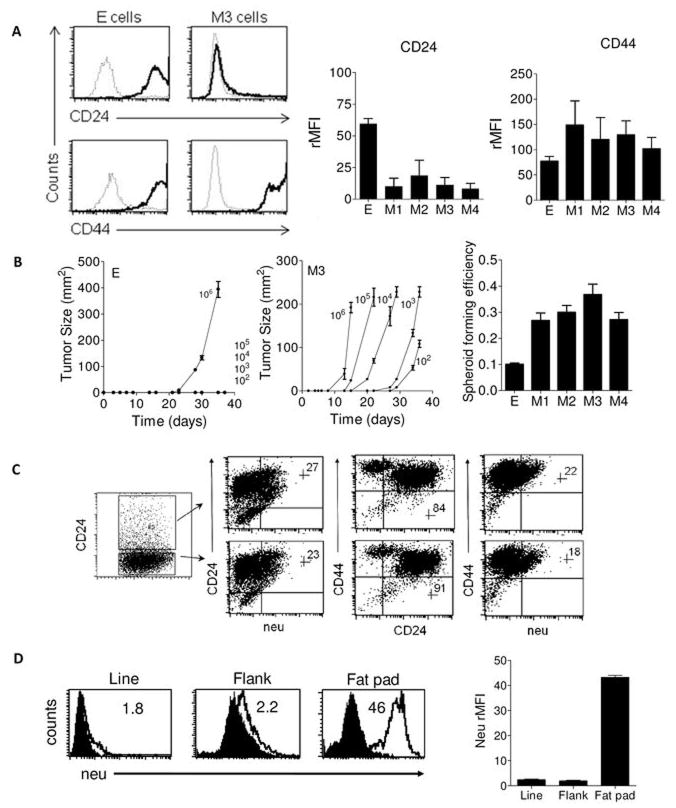
Figure 3. Mesenchymal cells are CD24−/loCD44+ and highly tumorigenic.
Panel A shows a representative histogram demonstrating that mesenchymal (M) tumor cells are CD24−/lo CD44+. Dark and light tracings represent specific and isotype fluorescence, respectively. Panel A also shows graphs that summarize CD24 and CD44 expression in the E and M cells. Shown are the average (± s.e.m.) relative mean fluorescent intensities (rMFI) calculated from 3 experiments. Panel B shows tumor growth curves of the E (left) and M3 (right) cell lines injected into neu-tg mice. Each data point is the mean (s.e.m.) tumor size calculated from three mice. Numbers indicate the dose of cells injected. On the right, images of the tumors (20X) and spheroids (20X) corresponding to E and M3 cell lines. The far right graph shows the mean (± s.e.m, n=5 independent experiments) spheroid forming efficiency of each line. Panel C (left) is a summary of dot plots from CD24, CD44, and neu expression in tumors derived from sorted CD24−CD44+ M3 mesenchymal cells. This experiment is representative of 4 similar experiments done with each of the mesenchymal cells lines. Quadrants were established using M3 cell line cells (not shown). Inset numbers indicate percentage of gated cells in upper right quadrant. Panel D shows histograms of neu expression in cells from a mesenchymal cell line (Line), flank tumors (Flank), and mammary fat pad tumors (Fat pad) are shown. Inset numbers represent the relative mean fluorescent intensity. Nearly identical results were seen with 4 different samples of each cell type which is shown averaged in accompanying graph.

