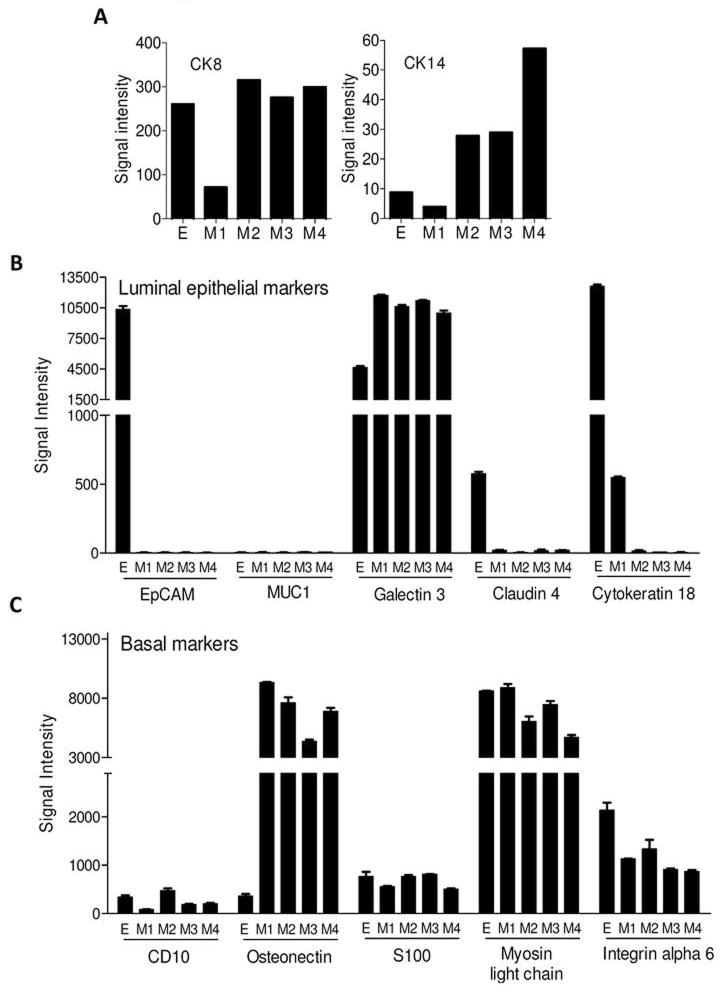
Figure 5. Gene expression of luminal or basal epithelial markers in mesenchymal cells suggests that EMT is incomplete.
Panel A shows the RT-PCR results depicting expression of CK8 (left) and CK14 (right) in the tumor cell lines. Results are representative of 3 independent experiments. Panels B and C show RNA microarray analyses of common luminal epithelial and basal markers in the cell lines, respectively. Shown are the mean (s.e.m.) signal intensities of 2 microarray analyses for each cell line. Each bar represents the signal intensity for a unique probe.

