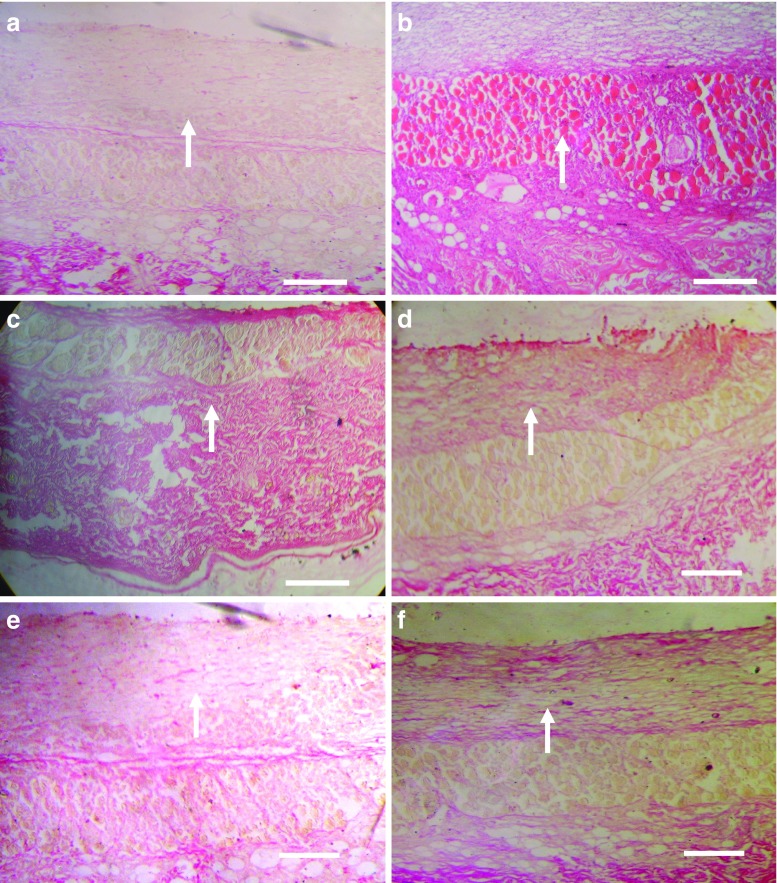
Fig. 5.
Picrosirius red-stained photomicrograph of skin of rat pouch model of sham control (a), control group treated with phosphate-buffered saline (b), drug solution (c), liposomes (d), niosomes (e), and optimized elastic liposomes (ELP20) (f) after 6 h of treatment. Arrow indicates collagen deposition. Scale bar = 500 μm. Magnification, ×100

