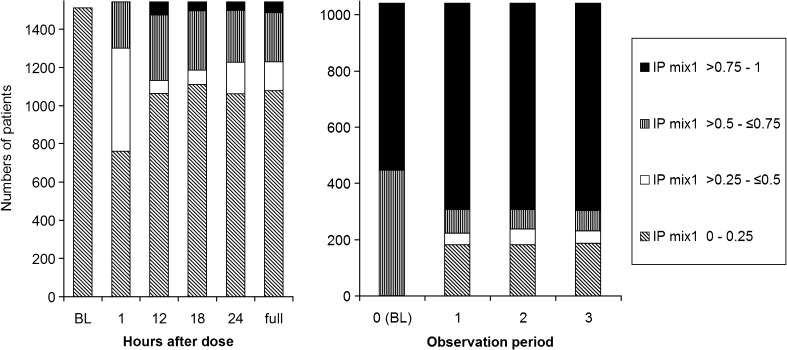
Fig. 2.
Frequency distribution of IPmix1 when using reduced data sets with observations included up to x hours for data set 1 and up to (and including) observation period x for data set 2. The left panel shows results for probability of stroke-induced sedation following clomethiazole or placebo, and right panel shows the responder probability following pregabalin treatment. The y-axis shows the number of patients in each category of IPmix1 values. BL = baseline

