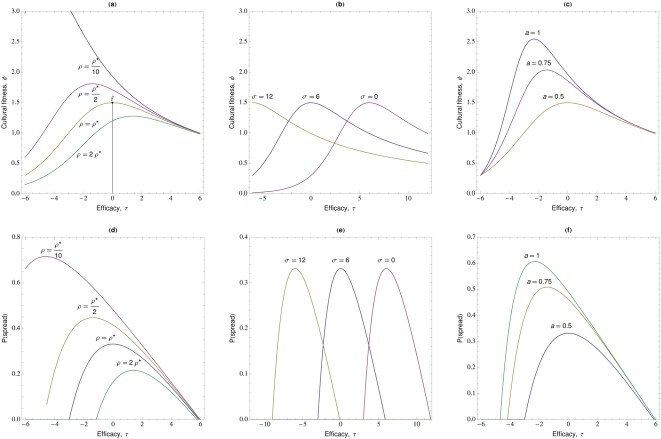
Figure 3. A single episode of illness and demonstration only during illness.
The cultural fitness (a–c) and probability of spread (d–f) of self-medicative treatments, plotted as a function of treatment efficacy,  , when there is a single episode of illness and demonstration occurs only during illness. Left (a and d), effect of varying maximum rate of abandonment,
  . Middle (b and e), effect of varying rate of recovery,
  . Right (c and f), effect of varying rate of decay in treatment abandonment. Unless otherwise stated
  ,
,  ,
,  ,
,  ,
,  ,
,  ,
,  ,
,  and
and  (see also Methods and Table 1).

