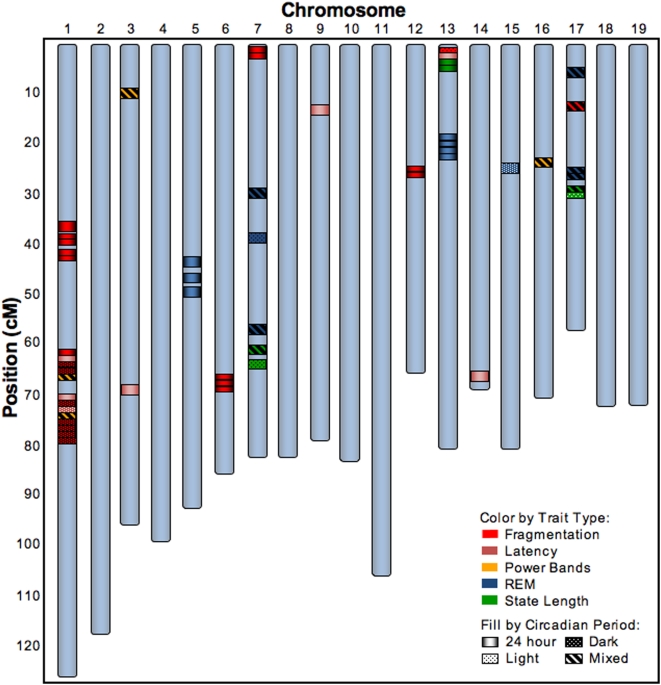
Figure 1. 52 QTL for 20 sleep-wake traits.
52 QTL shown by chromosome and cM positions that were identified for each of the sleep-wake traits listed in Table 1. The colored bands represent the position of the peak LOD score for each QTL and the fill of the bands denote the time period for the trait linkage as shown in the insert legend. Based on the factor analysis depicted in Table 1, the traits are grouped into 1 of 5 categories designated by the color of the bands as noted in the insert legend. The precise peak (in cM and Mb) and LOD score of the QTL, as well as the specific sleep-wake trait represented by each of the colored bands, are provided in Table 2. Further information on the size of the QTL are provided in Supporting Information Table S3.

