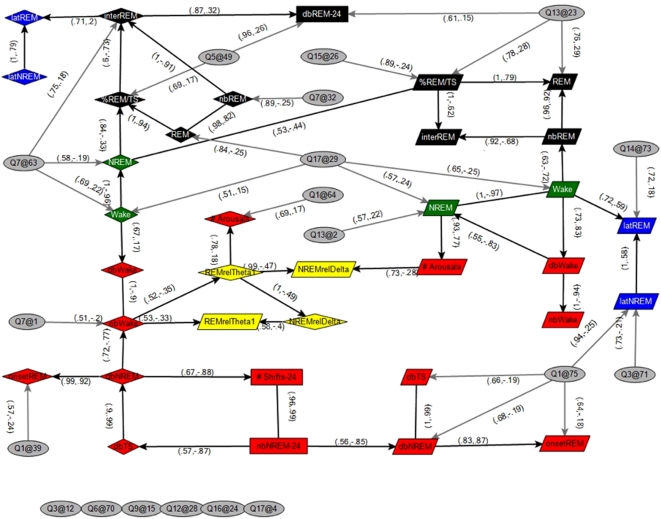
Figure 2. QTL and Sleep-wake Trait Network Analysis.
Bayesian network of sleep traits and significant QTL. Sleep-wake traits with QTL that differed in effects between the light and dark periods were represented in the network as two distinct traits, measured in the light and dark periods, denoted by diamond shapes (and suffix ‘l’) and parallelograms (and suffix ‘d’), respectively. The remaining sleep traits were averaged over the light and dark periods, denoted by rectangles (and suffix ‘24’). QTL are represented by ellipses, <chromosome>@<centiMorgan>. Edge labels include the confidence, which is the proportion of 1500 Markov Chain Monte Carlo (MCMC) learned networks that included the edge, and the Pearson correlation between nodes, respectively. Node colors represent trait types described in text; green: wake, black: REM, red: fragmentation, yellow: power band and blue: latency to REM. Edges that were present in greater than 50 percent of the MCMC runs were included in the network. Details of Bayesian network construction can be found in Supporting Information.

