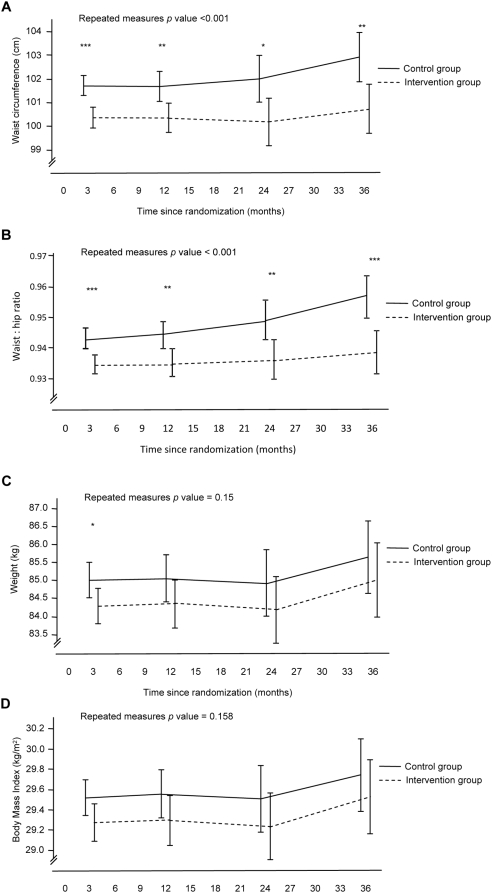
Figure 2. (A–D) Changes in anthropometrics.
Data are adjusted means (95% confidence intervals) for each time point derived from generalised line ar models with repeated measures. Adjustments are made for the baseline value for the respective outcome variable. Blood pressure values are also adjusted for medication load. Statistical significance at each follow-up time point generated from univariate analysis of variance, * p<0.05, ** p<0.01, *** p<0.001.

