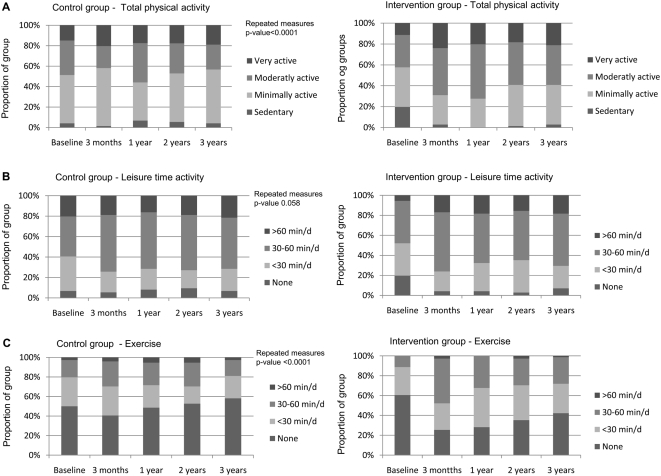
Figure 5. (A–C) Changes in physical activity level.
Proportion of participants reporting the level of each variable, total physical activity, leisure time physical activity and exercise and ordered as follows: TPA; sedentary, minimally active, moderately active and very active. LTPA and exercise; ‘none’ = 0, ‘<30 min/day’ = 1, ‘30–60 min/day’ = 2, and ‘>60 min/day’ = 3. P values from general linear model repeated measures analysis.

