Figure 5.
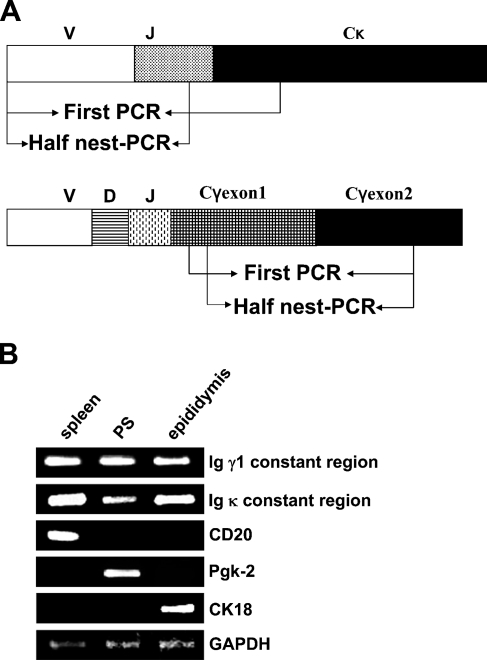
The results of RT-PCR. (A) Representative diagrams (not to scale) of the Ig γ1 and Ig κ genes analyzed in this study. Arrows indicate positions of the primers used for amplification of the segments. (B) The transcripts of Igγ1, Igκ, CD20, Pgk-2, CK18, and GAPDH in sorted primary spermatocytes and isolated epididymal epithelial cells were analyzed by RT-PCR. PS, primary spermatocyte. Spleen was used as a positive control. GAPDH expression was amplified as an internal control.

