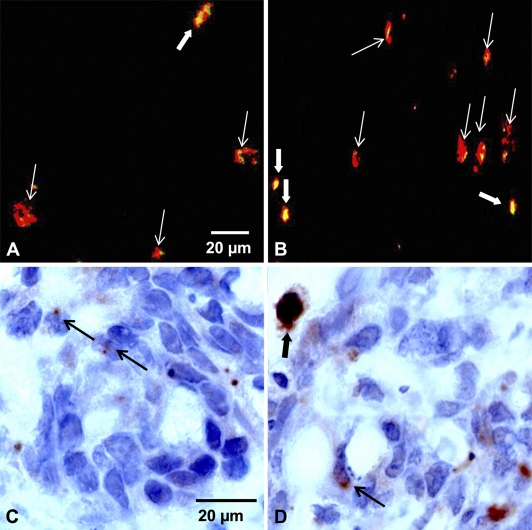
Figure 6.
Merging of immunofluorescence images obtained from control tumors (A) or Foscan (0.3 mg/kg, IV)-photosensitized (10 J/cm2, 30 mW/cm2) HT29 subcutaneous xenografts (B) frozen 24 hr after treatment. Frozen sections were first subjected to active caspase-3 (red fluorescence) and then to c-PARP (green fluorescence). Colocalization between both markers showed large yellow spots (thick white arrows) or tiny yellow spots (thin white arrows) caused by c-PARP expression. c-PARP IHC on paraffin sections of control tumors (C) and photosensitized tumors (D). Thin black arrows indicate limited expression of c-PARP, whereas the thick black arrow indicates a large expression of c-PARP in nuclei of apoptotic cells.

