
Figure 1.
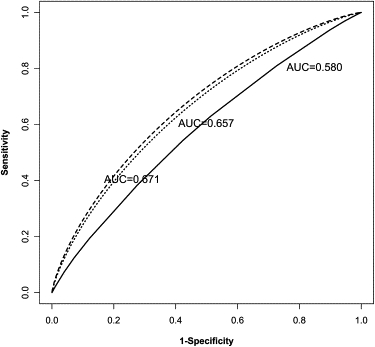
ROC Curves for Type 2 Diabetes
The three lines in the plot from bottom to top correspond to the ROC curves of three type 2 diabetes predictive tests: the rebuilt existing predictive genetic test based on three SNPs, the new predictive test combing the previously associated SNPs, four environmental factors, and four novel risk SNPs from the confirmatory stage of the genome-wide association study,9 and the improved new predictive test with five additional novel risk SNPs discovered in the second genome-wide association study of type 2 diabetes.10 The estimated AUC values of these three tests are 0.580, 0.657, and 0.671, respectively.