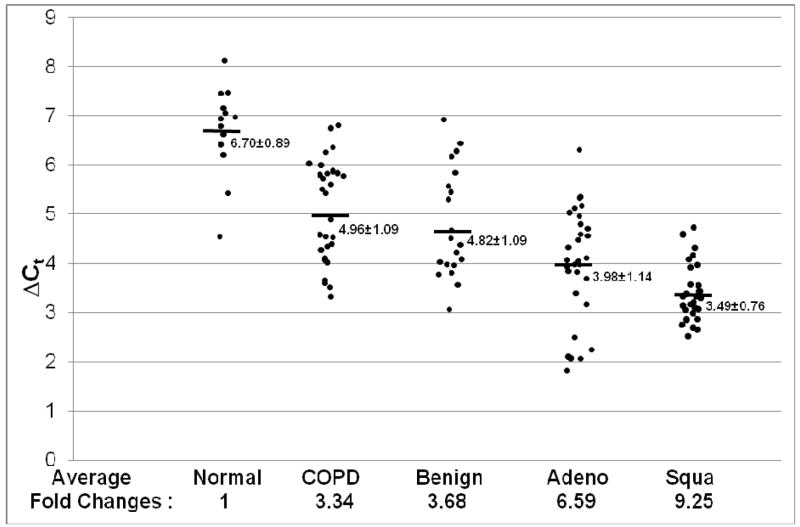
Figure 1. Stat3 mRNA expression in adenocarcinoma, squamous cell carcinoma and COPD.
Expression of Stat3 mRNA was measured by quantitative Real-Time PCR and normalized by GAPDH mRNA expression. Numbers in each column represent average ΔCt. Average fold changes were determined by 2(ΔΔCt), in which ΔΔCT= ΔCt(normal human samples) − ΔCt(cancer or COPD samples). Numbers on the bottom represent average fold changes compared to the normal human samples. Normal human samples were set up as one. Nor: normal samples. COPD: COPD samples from smokers. Benign: COPD samples from non-smokers. Adeno: adenocarcinoma. Squa: squamous cell carcinoma.

