
Figure 5.
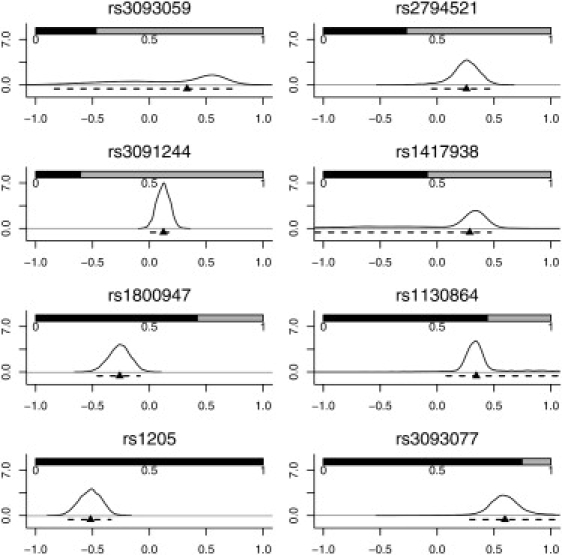
Results from the Multiple-SNP Meta-Analysis using the Bayesian Hierarchical Linear Model
The shaded bars show the posterior probability that each SNP is included in a model, calculated from the posterior sample of models. The x axis indicates the additive effects of each SNP on log CRP plasma levels, conditional on that SNP being included in the model, and the y axis indicates the corresponding posterior density. The curves can thus be interpreted as smoothed histograms representing the probability that the SNP effects take the values on the x axis. Also shown are the densities, medians (▴), and 95% credible intervals (- - -) for the additive effects of each SNP on log CRP levels.