
Figure 7.
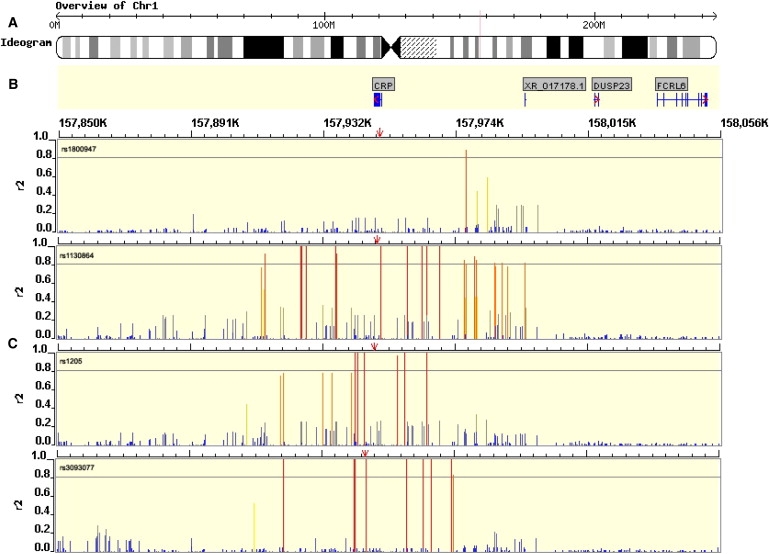
Genomic Context for CRP Gene
(A) Ideogram depicting the chromosome and region in which the CRP gene lies (red line).
(B) Gene diagram with introns and exons depicted as horizontal and vertical blue lines, respectively.
(C) Pairwise r2 LD values between independently associating SNPs from Bayesian analysis (identified in top left of window, position indicated by red arrow) and all other HapMap SNPs in the region (release 20, build 35, red = r2 > 0.8, yellow = 0.5 < r2 < 0.8, gray = 0.3 < r2 < 0.5, blue = 0.2 < r2 < 0.3, and dark gray = missing data).