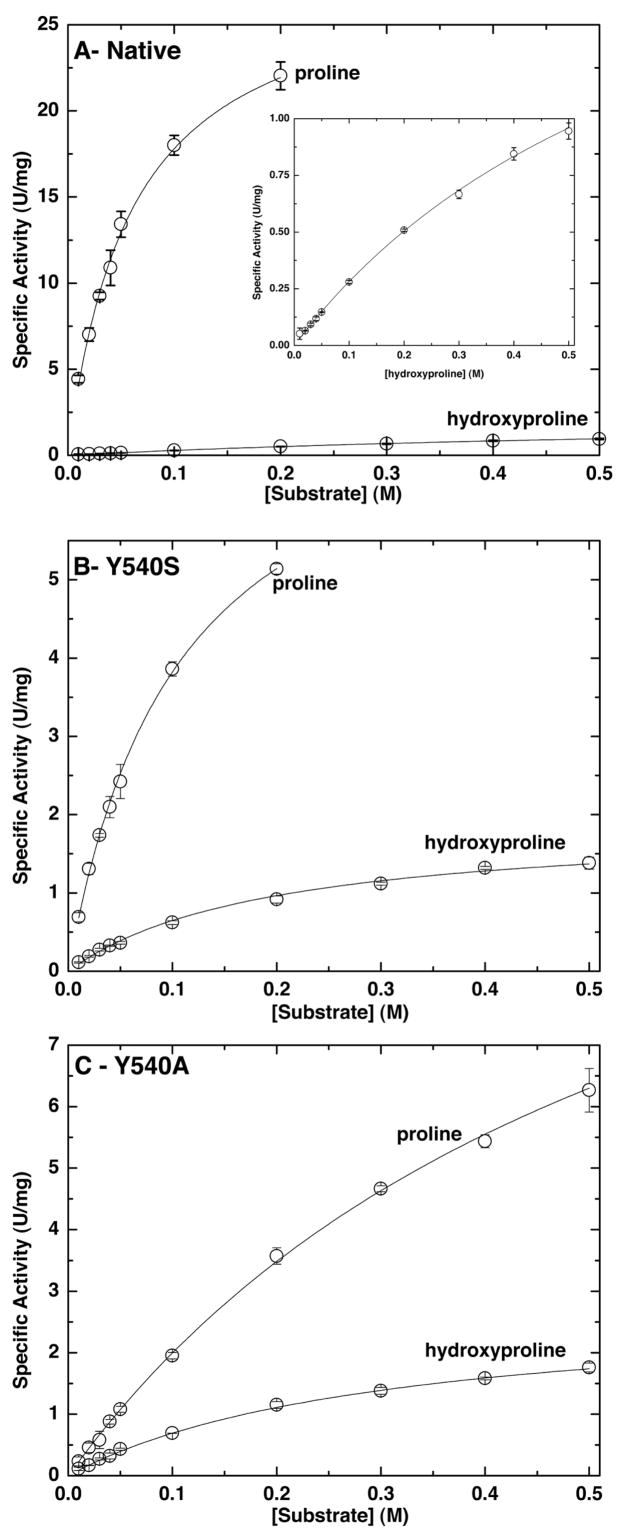
Figure 2.

Steady-state kinetic data for (A) native PutA86-360, (B) Y540S and (C) Y540A. In each panel, two sets of data are shown corresponding to the specific activity using proline and hydroxyproline as the substrate. The curves represent the best fit of the data to the Michaelis – Menten equation. The inset in panel A shows an expansion of the hydroxyproline data.
