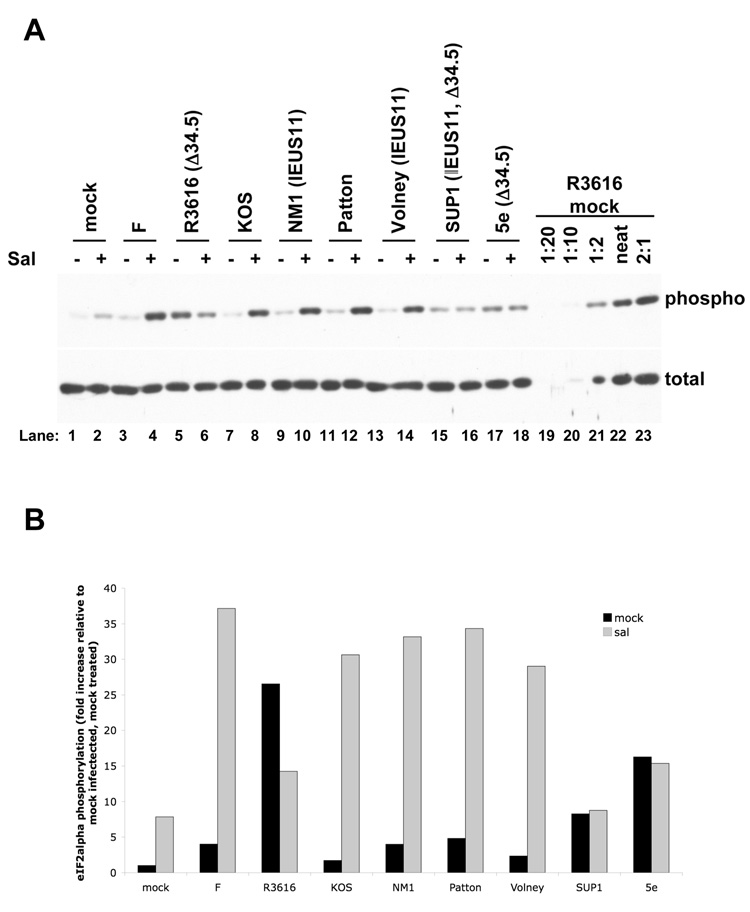
FIG. 7. Effects of salubrinal on eIF2α phosphorylation.
(A) Western blot analysis of eIF2α phosphorylation. Vero cells were treated with either 75µM sal (+, lanes 2, 4, 6, 8, 10, 12, 14, 16, and 18) or DMSO-containing vehicle (−, lanes 1, 3, 5, 7, 9, 11, 13, 15, and 17) for 24 hours prior to either mock infection (lanes 1 and 2) or infection with HSV-1 strain F (lanes 3 and 4), the ICP34.5 mutant R3616 (lanes 5 and 6), KOS (lanes 7 and 8), the IE US11 mutant NM1 (lanes 9 and 10), Patton (lanes 11 and 12), the IE US11 mutant Volney (lanes 13 and 14), the IE US11, ICP34.5 double mutant SUP1 (lanes 15 and 16), or the ICP34.5 mutant 5e (lanes 17 and 18) at an MOI of 3 in the presence of DMSO or sal. At 14 hours post infection, lysates were prepared and resolved by SDS-PAGE. Samples were resolved on duplicate gels and were immunoblotted for either total eIF2α (bottom panel) or serine-51 phosphorylated eIF2α (top panel). (B) Quantification of the western blot data in (A). The dilution series at the right end of each panel (lanes 19−23) were used to generate a standard curve by determining the intensity of each band on a scanned film using Quantity One software (BioRad). The standard curve was then used to determine the relative concentration of phosphorylated or total eIF2α in each sample. The level of phosphorylated eIF2α was normalized to the level of total eIF2α in each sample. The results are presented as the fold increase in phosphorylation relative to the normalized level of phosphorylated eIF2α in the mock treated, mock infected sample.

