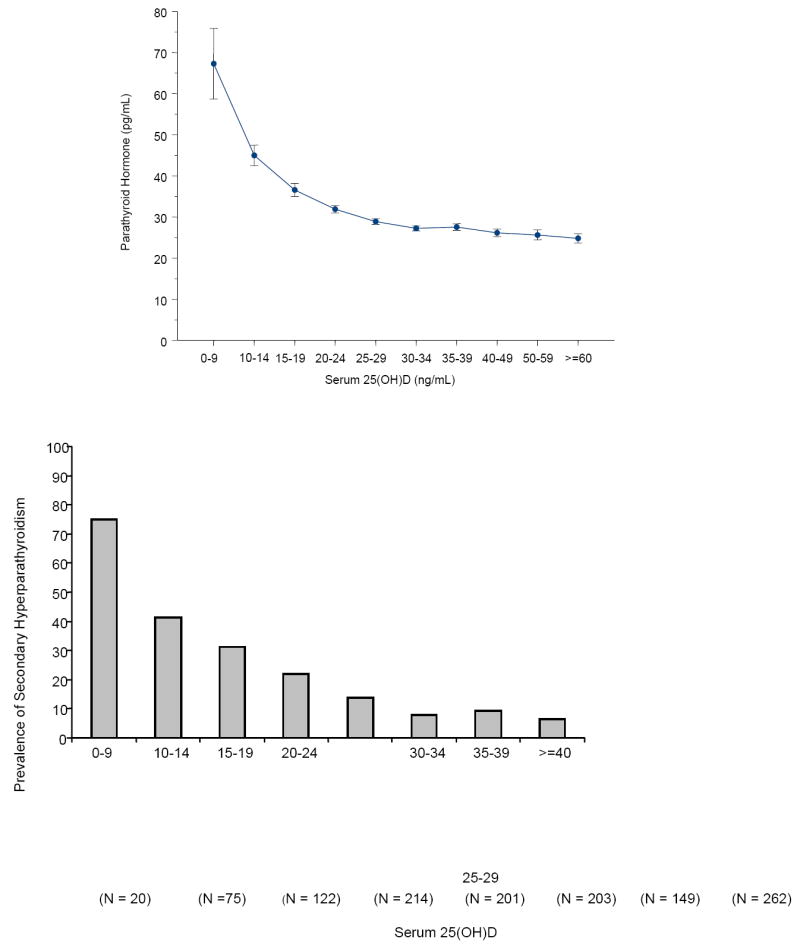
FIG. 2.

A, Mean (±SE) serum PTH (picograms per milliliter) by serum 25(OH)D subgroups. Subject PTH concentrations (picograms per milliliter) relative to serum 25(OH)D concentrations sorted by subgroups delineated by predefined cutoffs for analyses of 25(OH)D inadequacy. Serum PTH values began to increase with 25(OH)D concentrations less than 29.8 ng/ml. B, Percent of subjects with secondary hyperparathyroidism by 25(OH)D level. The percent of subjects with secondary hyperparathyroidism (PTH > 40 pg/ml) sorted by subgroups with serum 25(OH)D concentrations delineated by predefined cutoffs for analyses of 25(OH)D inadequacy. Reproduced with permission.14
