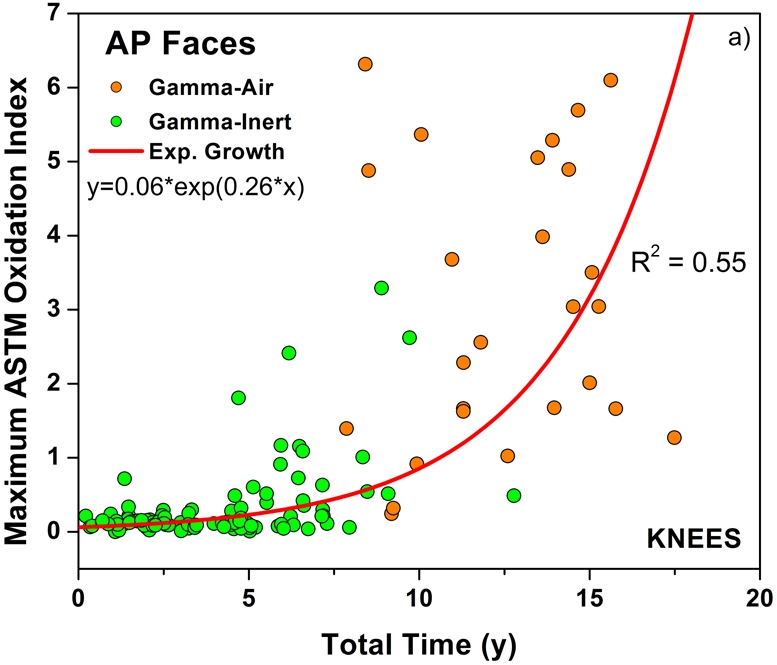
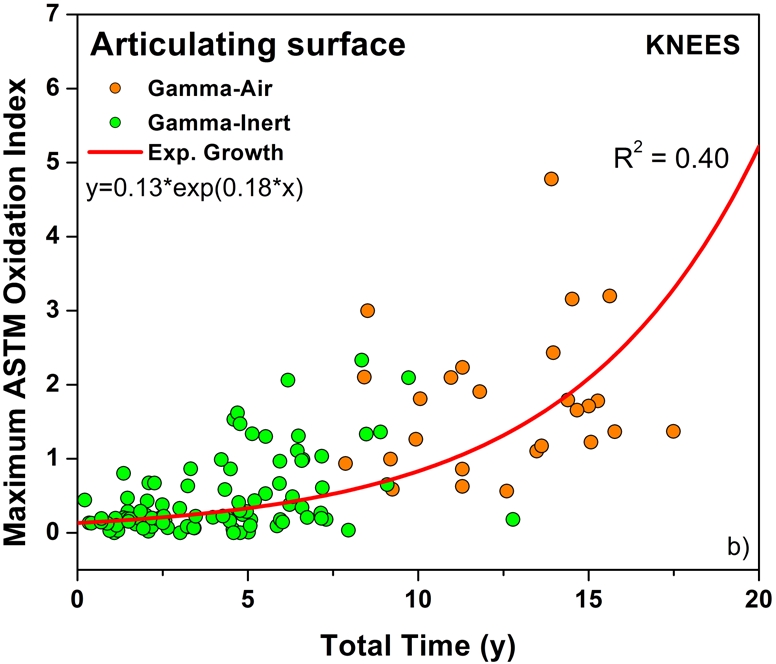
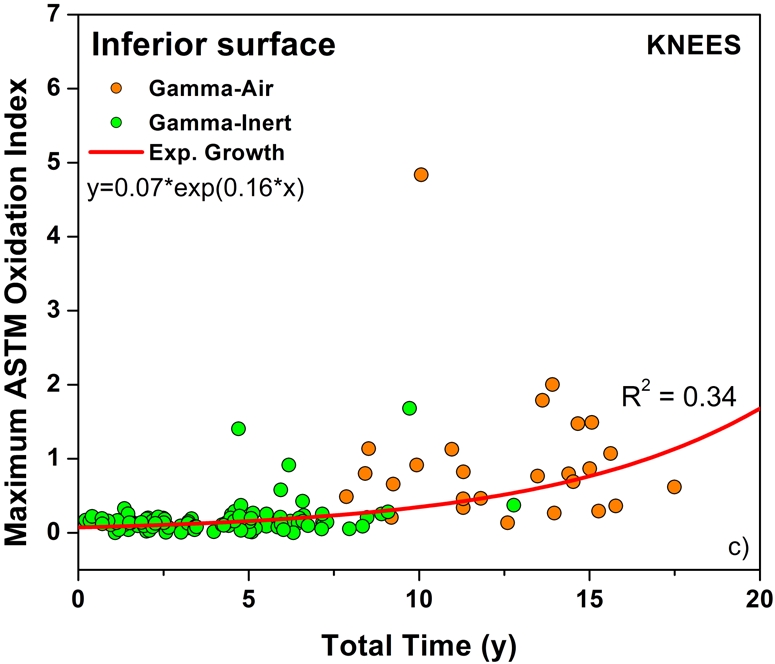
Fig. 4-A Fig. 4-B Fig. 4-C.


Oxidation rate plots, by region, for the anterior and posterior (AP) faces (Fig. 4-A) (r2 = 0.55, p < 0.0001), articulating surface (Fig. 4-B) (r2 = 0.40, p < 0.0001), and inferior surface (Fig. 4-C) (r2 = 0.34, p < 0.0001) for the retrieved tibial inserts. ASTM = ASTM International.
