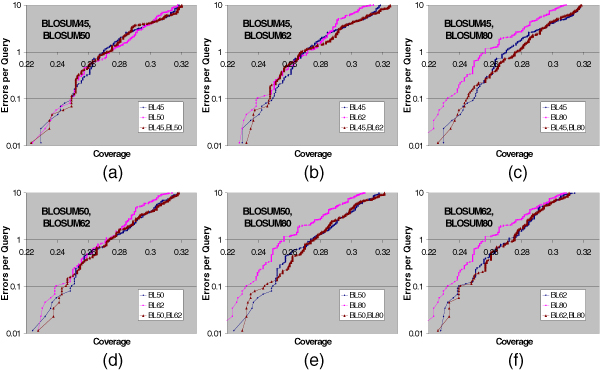
Figure 1.
Pairwise statistical significance using two parameter sets. Errors per Query vs. Coverage plot for pairwise statistical significance using two parameter sets, along with the curves using corresponding single parameter sets. (a) BLOSUM45, BLOSUM50; (b) BLOSUM45, BLOSUM62; (c) BLOSUM45, BLOSUM80; (d) BLOSUM50, BLOSUM62; (e) BLOSUM50, BLOSUM80; (f) BLOSUM62, BLOSUM80. In 5 panels (b) through (f) out of 6, using two parameter sets leads to better coverage than using a single parameter set at most error levels.

