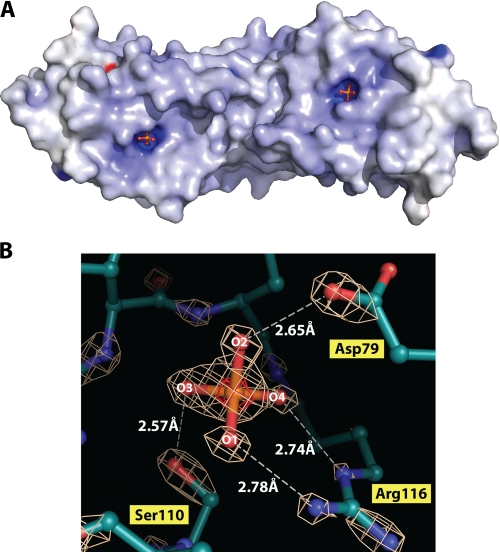
FIGURE 2.
Structural view of the VH1 active site at 1.32 Å resolution. A, electrostatic potential surface diagram of dimeric VH1. The two active sites form ∼6-Å-deep pockets on the surface of the dimer completely exposed to the solvent. B, enlargement of VH1 active site visualized crystallographically at 1.32 Å resolution. The final model, refined to an Rfree of 18.5% is superimposed to the final 2Fo - Fc electron density map contoured at 5.0σ above background (white). The anomalous signal of phosphate ion trapped in the active site is shown in red and is contoured at 6σ above background.

