FIGURE 3.
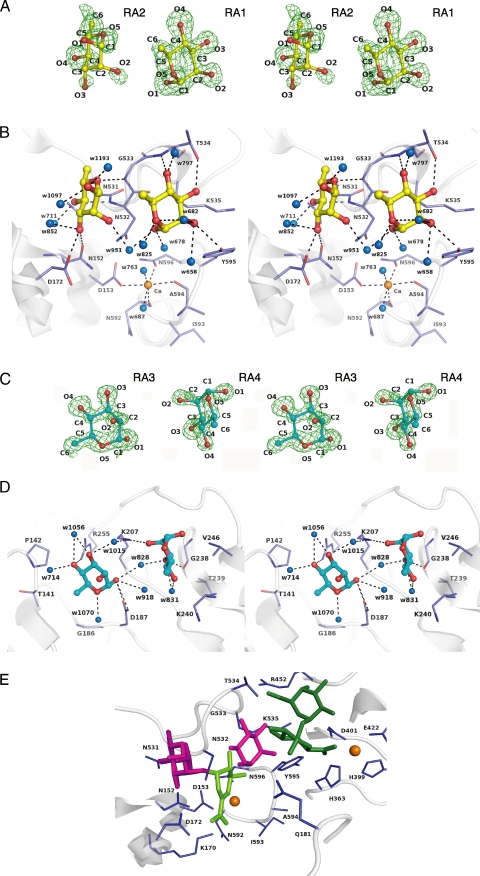
Rhamnose binding. A, electron density of Rha molecules in the active cleft by the omit map (Fo - Fc) calculated without Rha and countered at 3.0 σ. B, residues interacting with Rha molecules in the active cleft. C, electron density of Rha molecules in CBM-like domain by the omit map (Fo - Fc) calculated without the Rha and countered at 3.0 σ. D, residues interacting with Rha molecules in the CBM-like domain. Amino acid residues and Rha molecules are shown by colored elements: oxygen atom, red; carbon atom, blue in residues, yellow in Rha molecules RA1 and RA2, and cyan in RA3 and RA4; nitrogen atom, deep blue. The calcium ions are shown as orange balls, and water molecules are blue balls. Hydrogen bonds are shown as dashed lines. The characters indicate the saccharide number and its atoms in A and C and the amino acid residues number in B and D. E, structural superimposition in the active site between YesW/Rha and YesW/GalA-GalA. Rha and GalA-GalA molecules are shown by magenta and green sticks, respectively. The reaction product, ΔGalA-Rha, is fitted on the active site by structural simulation. ΔGalA is represented by light green sticks.

