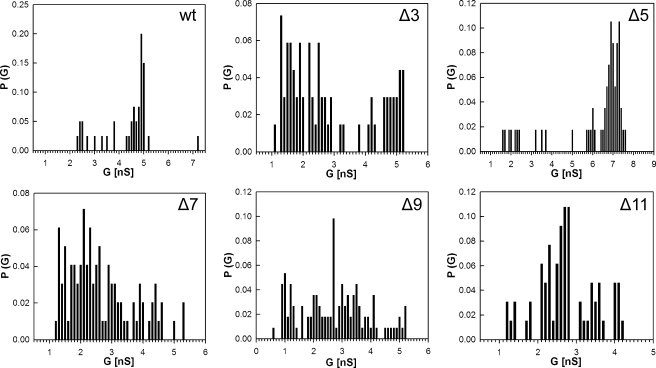
FIGURE 4.
Analysis of single channel conductances of purified MspA deletion mutants. Analysis of the probability P of a conductance step G for single channel events. The average single channel conductances were 4.9, 1.3, and 5.1 (bimodal), 7.0, 2.1, 2.6, and 2.8 nS for wt, Δ3, Δ5, Δ7, Δ9, and Δ11, respectively.

