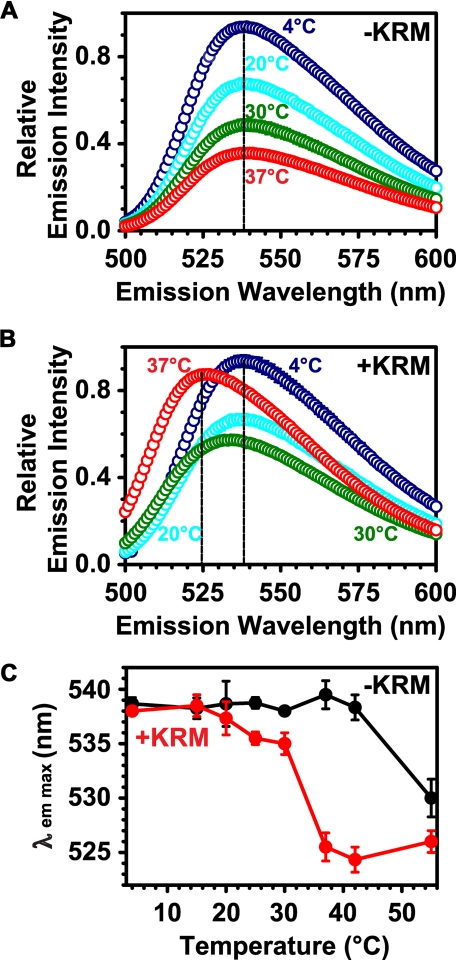
FIGURE 3.
Temperature dependence of the RTA259-NBD probe environment. Net emission scans (λex = 468 nm) of RTA259-NBD (450 nm) are shown in the presence of either microsome buffer (A) or of KRMs (B; 15-20 eq) at increasing temperatures in buffer H (A and B: only 4, 20, 30, and 37 °C are shown). The λem max at different temperatures is shown in (C). The averages of three independent experiments are shown, and the error bars indicate the S.D. of the experiments. However, most of the error bars in A and B are smaller than the circles on the graph.

