FIGURE 4.
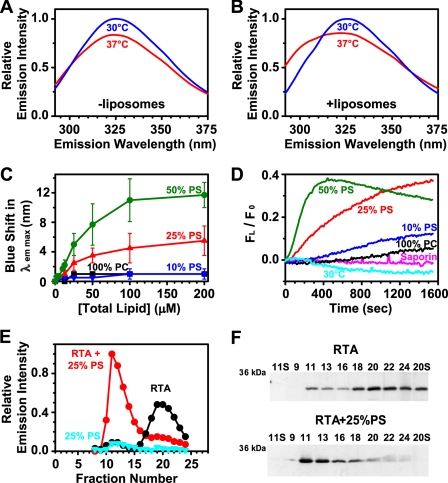
Temperature and PS dependence of RTA binding to liposomes. Trp emission spectra (λex = 280 nm) of 7 μm RTA are shown in the absence (A) and presence (B) of 200 μm PCPS liposomes at 30 °C and 37 °C in buffer C. The λem max of RTA Trp emission was determined as a function of phospholipid concentration and composition (C). The error bars show S.D. from two or three experiments. D, after the addition of liposomes at 0 s, Trp emission intensity at 300 nm (FL) was monitored over time relative to the initial liposome-free intensity (F0). Emission intensity data were corrected by both subtraction of the signal obtained from samples lacking RTA and subtraction of the signal obtained by RTA or saporin alone. The average of at least two different experiments is shown. E and F, RTA was incubated for 30 min at 37 °C with 200 μm PCPS liposomes, the mixture was subjected to gel filtration on a Sepharose CL-2B column (18 × 0.5-cm inner diameter), and 250-μl fractions were collected. The samples were analyzed for RTA emission intensity (λex = 280 nm; λem = 322 nm; E) and protein content by SDS-PAGE followed by silver staining (F). The lanes are labeled in fraction numbers with S indicating the loaded supernatant of given fractions following a 10-min microcentrifuge centrifugation at 14,000 rpm.

