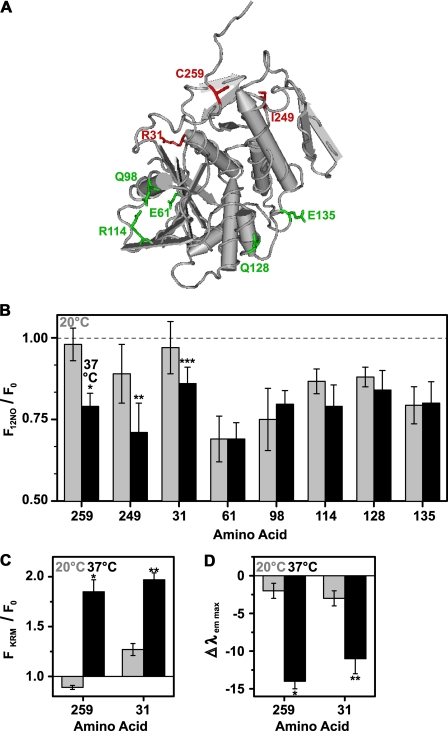
FIGURE 8.
Exposure of different RTA residues to the membrane interior. A, the tube worm representation of the α-carbon backbone of the RTA crystal structure is shown. Amino acids that are exposed to the membrane at 20 °C are shown in green, whereas amino acids that are exposed to the nonpolar lipid core only at 37 °C are indicated in red. B, the emission intensities of NBD-labeled RTA mutants (450 nm in buffer H) were measured before and after the addition of PCPS liposomes. Emission intensities of parallel samples containing either 22.5 mol% 12NOPC (F12NO) or 22.5 mol% of PC (F0) were compared at 20 °C (gray bars) or at 37 °C (black bars), respectively. The averages of at least three independent experiments are shown, and the error bars indicate the S.D. of the experiments. Sequence numbers of NBD-labeled amino acids are shown on the x axis. *, p = 0.0004; **, p = 0.04; ***, p = 0.07 when compared with the corresponding quenching efficiency at 20 °C (Student's t test). C and D, the ratio of RTA mutant (450 nm in buffer H) NBD emission intensity (C) and the change in λem max (D) are shown before (F0) and after (FKRM) binding to KRMs (20 eq), either at 20 °C (gray bars) or at 37 °C (black bars). The average of at least three independent experiments is shown, and the error bars indicate the S.D. of the experiments. A, *, p < 0.00004; **, p < 0.0002. B, *, p < 0.00001; **, p < 0.001 when the measurements at 20 °C were compared with those at 37 °C (Student's t test).

