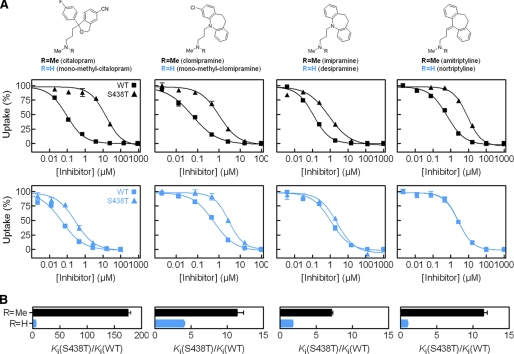
FIGURE 4.
Functional [3H]5HT uptake inhibition analysis at hSERT WT and hSERT S438T. A, upper, structure of inhibitors having one (R = H) or two (R = CH3) methyl groups at the aminopropyl chain. Lower, characterization of pairs of inhibitors having a single (blue squares, WT; blue triangles, S438T) or two (▪, WT; ▴, S438T) methyl groups at the aminopropyl chain. B, graphical summary of observed fold change in Ki between WT and S438T for each inhibitor pair (mean ± S.E.; n = 6-8). Ki values and statistics are shown in Table 1.

