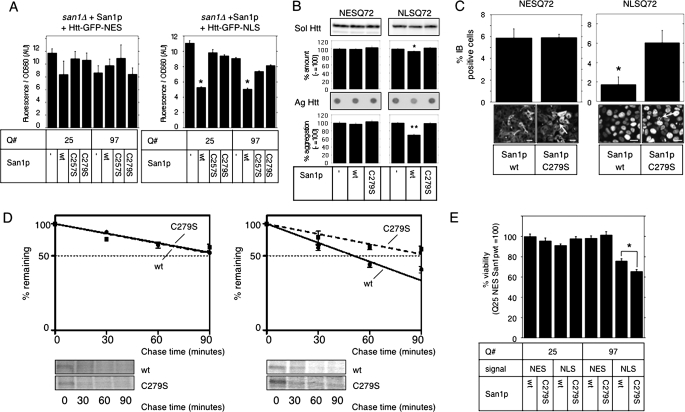
FIGURE 1.
San1p accelerates nuclear Htt degradation. A, rescue expression of wt San1p in san1Δ yeast cells reduces Htt-NLS. ADH1 promoter-driven wild-type San1p or its RING mutants (C257S and C279S) were cotransformed into san1Δ cells with GAL4-driven Htt-GFP-NES (left) or NLS (right) containing 25 or 97 glutamines (Q#). Normalized Htt-GFP expression was measured after 2% galactose induction for 4 h. Bars indicate ±S.E. *, p < 0.0001 versus cotransformation with empty vector (–), C257S, or C279S. B, San1p reduces NLS-Q72 aggregates in HeLa cells. FLAG-tagged San1p was expressed in NESQ72 or NLSQ72 cells. After 48 h, the amount of soluble GFP-Htt (Sol Htt) was measured by immunoblot (upper bands and graphs) and those of insoluble aggregates (Ag Htt) were measured by filter trap analysis (lower dots and graphs). The intensity (relative to empty vector (–)) of bands or filter-retained spots was quantified and plotted. Bars indicate ±S.E. *, p = 0.0016; **, p < 0.001 versus empty vector. C, effect of San1p overexpression on NESQ72 (left) or NLSQ72 (right) aggregation was assessed by IB frequency. Cells with IBs were counted (n > 100 from three independent trials) and quantified (top graphs). Black bars indicate ±S.E. Representative images from each experiment are shown at the bottom. Arrows indicate IBs; scale bar = 20 μm. *, p = 0.0108 versus C279S. D, San1p accelerates NLSQ46 degradation. wt or C279S San1p was overexpressed in NESQ46 or NLSQ46 cells for 48 h, and a pulse-chase experiment was performed. Band intensities from SDS-PAGE were normalized by the ratio to those at time = 0 and plotted onto semi-log charts below with fitted lines (wt: straight lines; C279S: broken lines). Bars indicate ±S.E. E, San1p overexpression rescues acute pQ toxicity. NES- or NLS-attached Htt-GFP (signal) with 25 or 97 glutamines (Q#) were transiently coexpressed with wt San1p or C279S mutant (San1p) in HeLa cells for 72 h. Cell viability was measured by colorimetric assay (relative to NESQ25 plus San1pwt; n = 3). Bars indicate ±S.E. *, p = 0.005511.

