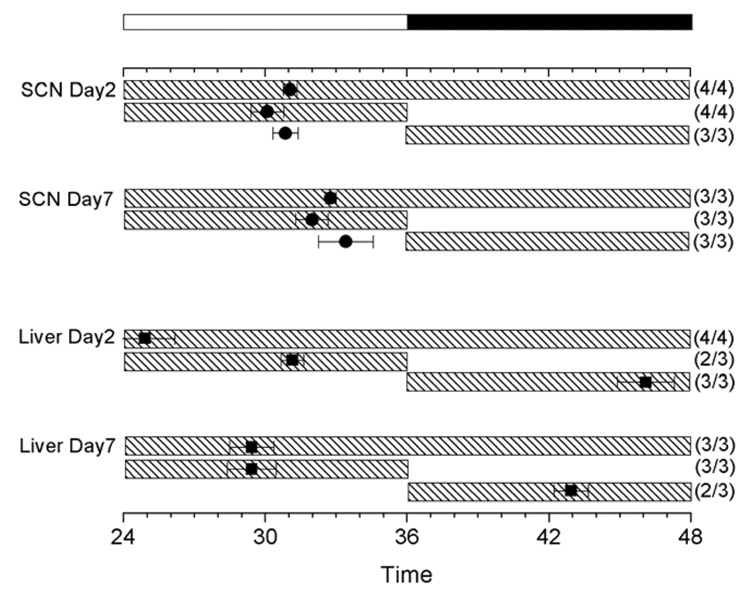
Figure 5. Effect of maternal presence/absence cycles on circadian rhythm phase in the SCN and liver.
The average times (±SEM) of peaks are plotted in Figure 2. The light cycle is plotted as a black and white bar at the top of the figure. Shaded bars indicate the time when pups were with their dams (top: control, mid: light group, bottom: dark group). Both SCN and liver were cultured after either 2 or 7 days of P/A cycles as indicated. No significant differences were found in SCN (by ANOVA). The phase of liver in the dark-fed group on Day 7 was significantly different from both the control and the light-fed group (ANOVA followed by Dunnett’s test, P<0.05).

