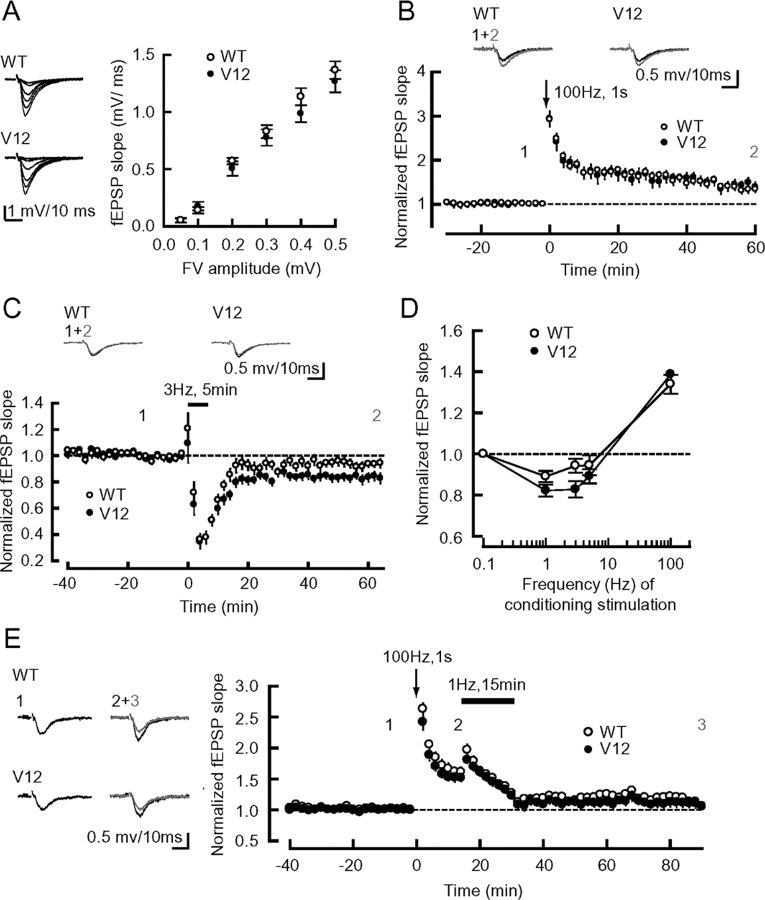
Figure 5.
Synaptic transmission and plasticity in Rap2V12 hippocampal slices. A, Left, Sample traces (average of 10 consecutive responses) represent the responses evoked with six different stimulus intensities from wild-type or Rap2V12 hippocampal slices. Stimulus artifacts were truncated. Right, Summary graph of the input–output relationships of field EPSPs of wild-type (n = 9 slices from 5 mice) and Rap2V12 mice (n = 9 slices from 5 mice). The symbols indicate the mean ± SEM. FV, fiber volley. B, Top, Sample traces of field EPSPs of wild-type and Rap2V12 mice recorded at the times indicated in summary graph. Bottom, Summary graph of the averaged time course of LTP (WT, n = 7 slices/4 mice; Rap2V12, n = 8 slices/5 mice). Tetanic stimulation (100 Hz; 1 s) was applied at 0 min. Initial EPSP slopes were measured, and the values were normalized to the averaged slope value measured during the baseline period (−30–0 min). C, Sample traces (above) and summary graph (below) of the averaged time course of LTD (WT, n = 11 slices/8 mice; Rap2V12, n = 12 slices/8 mice). A 3 Hz, 5 min stimulation protocol was applied at 0 min. D, Shown is a frequency–response graph of the fEPSP changes induced by four different stimulus frequencies; 0.1 Hz was used to monitor synaptic transmission throughout the experiments. E, Sample traces (left) and summary graph (right) of the averaged time course of depotentiation (WT, n = 11 slices/7 mice; Rap2V12, n = 11 slices/8 mice). After tetanic stimulation (100 Hz; 1 s) at 0 min, low-frequency stimulation (1 Hz; 15 min) was applied at 15 min to induce depotentiation.

