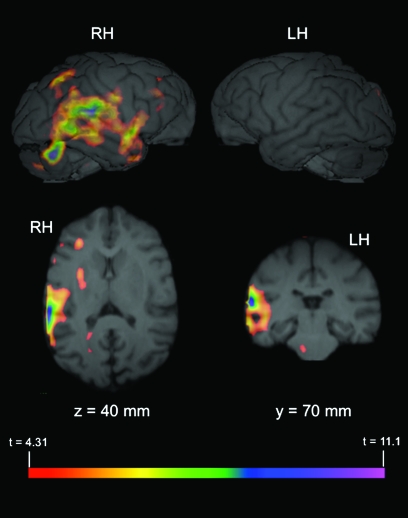
Figure 2.
Significant lateralized activation (PRV > TRV). The average comparison volume (PRV > TRV) from all 3 subjects was flipped on the x-axis (i.e., right-left) and then subtracted from the correctly oriented volume. A t-map volume was then calculated from this subtracted volume (see Materials and Methods), and significant areas of activation identified, t ≥ 4.31. The figure depicts PET activation overlaid on MR images (top: 3D rendered brain; bottom left: axial plane; bottom right: coronal plane) of representative chimpanzee brain. x, y, and z and corresponding values refer to planes and anatomical locations described in Figure 1. Values indicate significantly lateralized activity in that hemisphere (i.e., cluster in RH of brain indicates right hemisphere activation is greater than activation in corresponding area in the left hemisphere).

