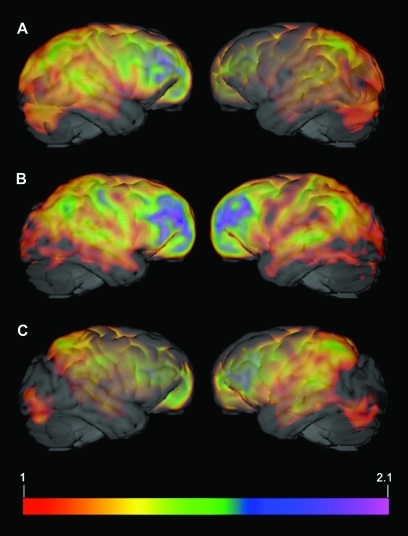
Figure 4.
Individual TRV data for all 3 subjects. Standardized individual PET volumes for the TRV condition for subject 1 (A), subject 2 (B), and subject 3 (C) overlaid on the MR image of a representative chimpanzee brain. Images were created by dividing each subject's TRV volume by the respective mean metabolic activity for the entire brain in that condition (TRV). Activation threshold was set to 1. Any value over 1 indicates a value that is greater than the mean activity for that subject in that condition (i.e., 1 = the mean whole-brain metabolic activity for that subject in the TRV condition).

