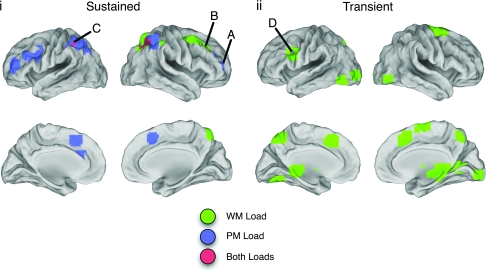
Figure 3.
Panel i illustrates ROIs demonstrating sustained responses to PM load, WM load, or both. Panel ii illustrates ROIs demonstrating transient, ongoing responses to WM load. ROIs in blue demonstrated an increased BOLD response to PM task demands (either sustained or transient ongoing, as indicated by the panel). ROIs in green demonstrated an increased BOLD response to WM load. ROIs in red demonstrated an increased response to PM and WM loads. Labels correspond to ROI labels from Tables 1 and 2.

