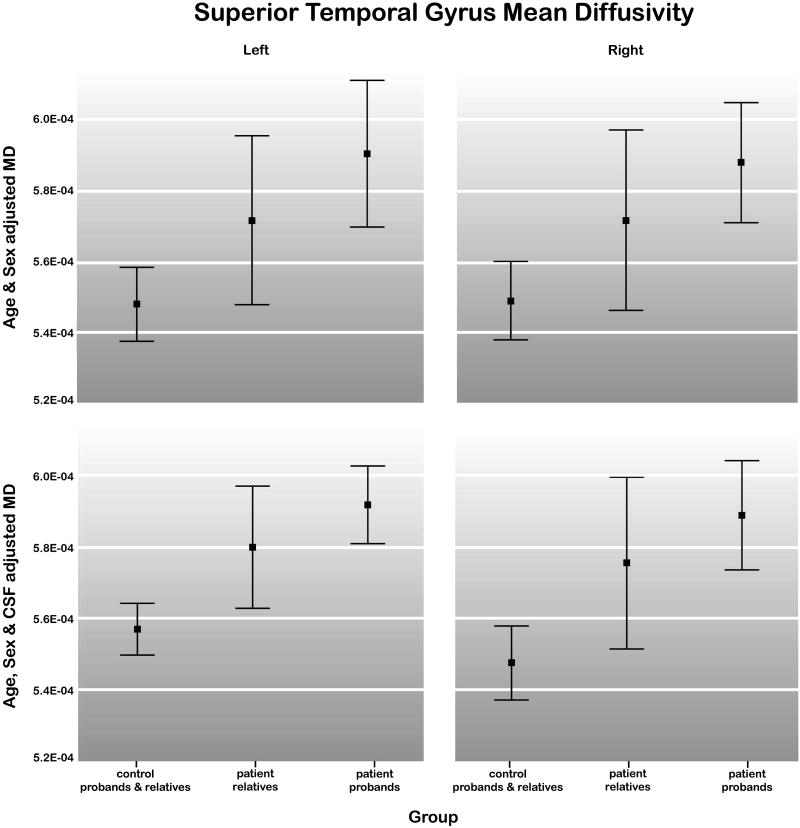
Figure 3.
Means and 95% confidence intervals for left and right superior temporal gyrus MD within control probands and relatives (n = 52), patient relatives (n = 36) and schizophrenia probands (n = 26). Results are shown after adjusting the data for sex and age (top) and for sex, age and CSF volume (bottom).

