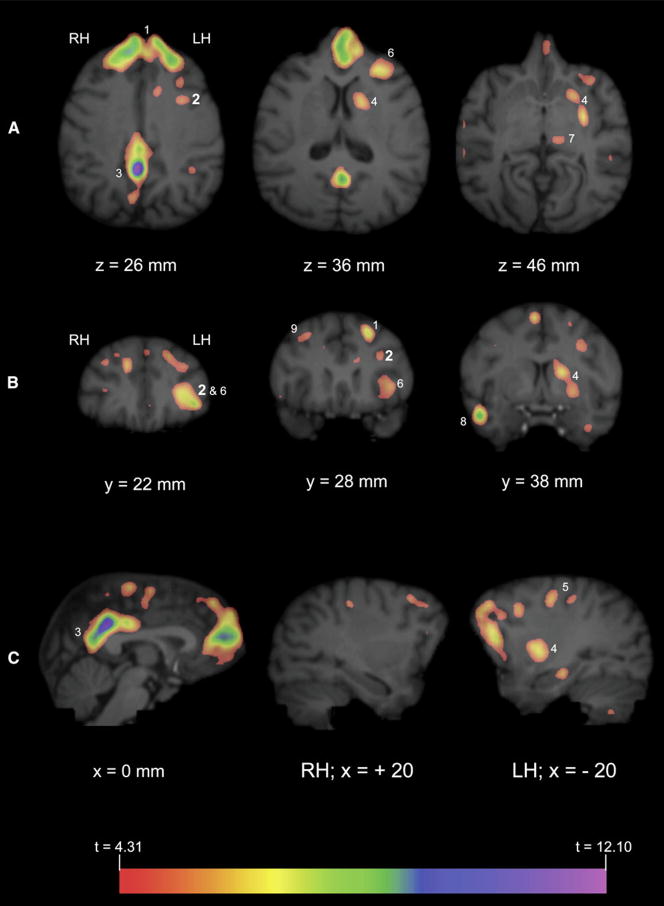
Figure 2. Significant Areas of Activation for Communicative Production.
PET activation (GV > BL) was overlaid on MR images of representative chimpanzee brain. “x,” “y,” and “z” refer to the planes described in Figure 1. Measurements refer to the depth from the dorsal tip of the brain (z, dorsal to ventral), distance from frontal pole (y, anterior to posterior), or distance from midsagittal (x, ascending positive values correspond to the right hemisphere, medial to lateral; ascending negative values correspond to the left hemisphere, medial to lateral). Panels display axial (A), coronal (B), and sagittal (C) views of MR images with significant GV > BL activation. Numbers correspond to the following anatomical locations: 1, bilateral superior frontal gyrus; 2, left inferior frontal gyrus (depicted in large bold type); 3, bilateral posterior cingulate gyrus; 4, left caudate/putamen; 5, left medial pre- and postcentral gyrus; 6, left frontal orbital gyrus; 7, left thalamus; 8, right middle temporal gyrus; 9, right middle frontal gyrus. Note that not all areas of activation are labeled in all planes. See Table 1 for a complete list of regions with significant GV > BL activation.

