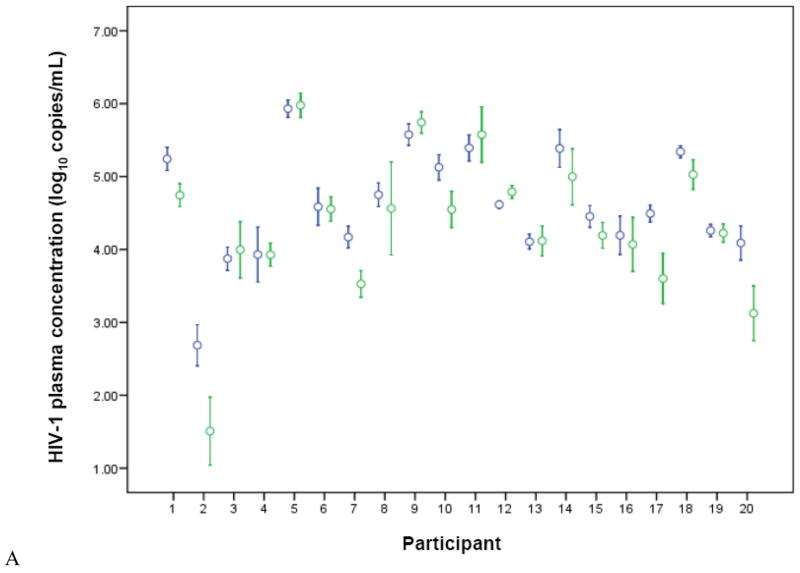
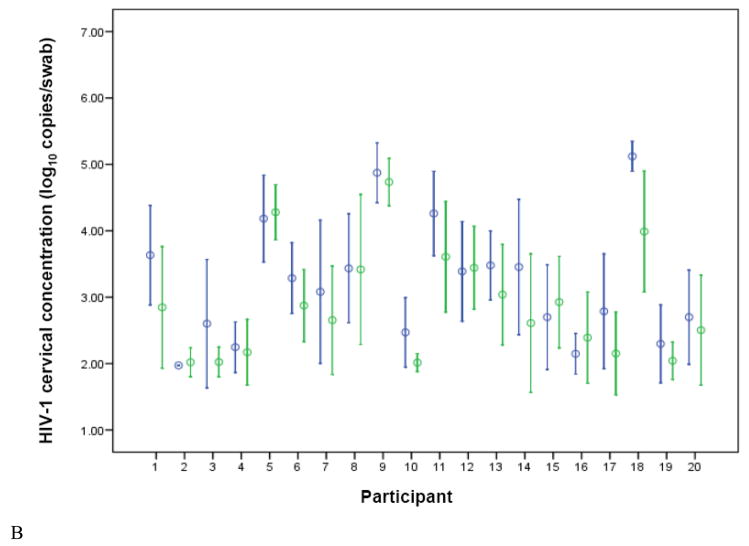
Figure 1.
HIV-1 concentrations in plasma (A) and cervical (B) samples, for each study participant, stratified by treatment arm (blue = placebo, green = valacyclovir). Circles represent the mean and brackets indicate 1 SD. Undetectable levels were imputed at the midpoint between zero and the lower limit of quantification.


