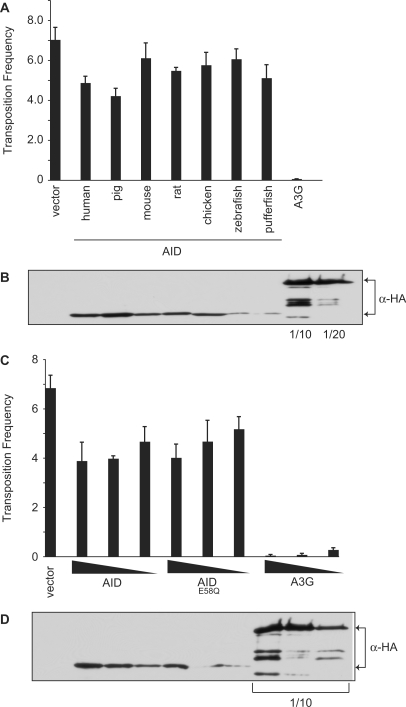
Figure 6.
Effect of AID on MusD retrotransposition. (A) The transposition frequency of MusD in HeLa cells co-transfected with the MusD plasmid and the indicated AID-HA or A3G-HA expression vectors, and a GFP marker plasmid. Transposition frequency was calculated as the number of neomycin-resistant colonies/transfection efficiency (percent GFP+). Histogram bars represent the mean of three independent cultures, and the standard deviation is shown. P-values were calculated for each construct using the Student's t-test and are as follows: human, P = 0.0055; pig, P = 0.0020; mouse, P = 0.40; rat, P = 0.014, chicken, P = 0.14; zebrafish, P = 0.25; pufferfish, P = 0.032; A3G, P = 0.000013. (B) Western blot showing expression of the HA-tagged proteins from a representative experiment from (A). The A3G lysate was diluted 1/10 or 1/20, as indicated. (C) The transposition frequency of MusD in HeLa cells co-transfected with the MusD plasmid and varying amounts the AID, AIDE58Q or A3G expression vectors, and a GFP marker plasmid. The amount of AID/A3G plasmid transfected is indicated below the graph. Transposition frequency is calculated as the number of neomycin-resistant colonies/transfection efficiency (percent GFP+). Bars represent the mean of three independent cultures. Error bars indicate the standard deviation from the mean. (D) Western blot showing expression of the HA-tagged proteins from a representative experiment from (C). The A3G lysates were diluted 1/10, as indicated.

